

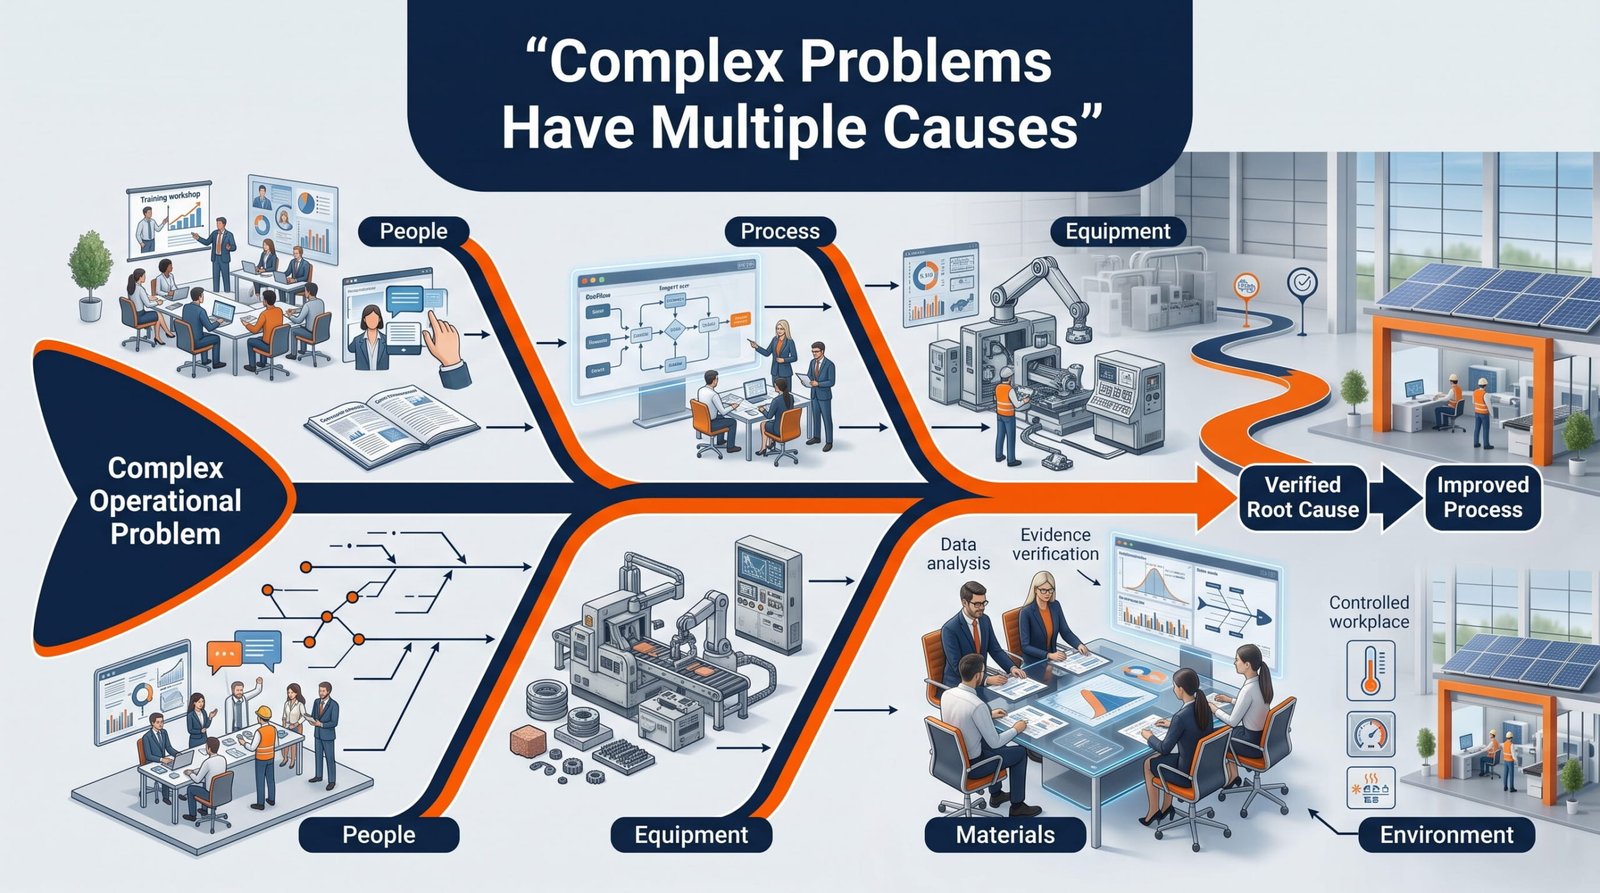
Complex problems rarely come from a single source. A recurring defect may involve employee practices, process weaknesses, equipment conditions, material quality, or the working environment. When teams focus on only one factor, they may solve a symptom without addressing the conditions that created the problem.
This is why Root Cause Analysis (RCA) requires a structured approach.
The Fishbone Diagram, also known as the Ishikawa Diagram or Cause and Effect Diagram, helps teams explore potential causes systematically. Instead of immediately selecting one explanation, teams can examine multiple contributing factors and investigate how they may influence the problem.
By organizing potential causes into clear categories, Fishbone Analysis gives organizations a practical foundation for deeper investigation, better decision-making, and sustainable process improvement.
Why Complex Problems Need Structured Analysis
Organizations often respond to problems under pressure. When a production delay, quality failure, or customer complaint occurs, teams may look for the fastest possible solution.
Quick action can contain an immediate problem. However, containment does not necessarily identify its underlying cause.
For example, a manufacturing defect may initially appear to result from operator error. Further investigation could reveal that the operator received incomplete training, the procedure lacked clear instructions, the equipment required maintenance, or the incoming material varied from specification.
Each factor could contribute to the same outcome.
A structured analysis prevents teams from narrowing their investigation too early. It encourages them to consider different possibilities before deciding which causes require further verification.
What Is a Fishbone Diagram?
A Fishbone Diagram provides a visual method for organizing potential causes of a specific problem.
The diagram resembles a fish skeleton. The problem appears at the head, while major cause categories form the branches leading toward it. Teams then add specific potential causes under each category.
The exact categories can vary depending on the industry and problem. However, organizations commonly examine areas such as:
- People
- Process
- Equipment
- Materials
- Environment
The purpose is not to prove that every listed factor caused the problem. Instead, the diagram creates a structured list of possibilities that teams can investigate using evidence.
This distinction matters. A Fishbone Diagram generates hypotheses. Data and investigation determine which causes actually contributed to the problem.
People: Examining Human Factors
People can influence process performance in many ways. Skills, training, communication, workload, experience, and adherence to procedures can all affect outcomes.
When analyzing the People category, teams may ask:
- Did employees receive appropriate training?
- Were responsibilities clearly defined?
- Was adequate supervision available?
- Did workload affect performance?
- Were instructions understood correctly?
- Did communication gaps contribute to the issue?
However, organizations should avoid automatically blaming employees.
Human error often reflects weaknesses within the broader system. A more effective investigation examines what conditions made the error possible.
Process: Looking at How Work Gets Done
Processes determine how activities move from one stage to another. Poorly designed or inconsistent processes can create recurring problems even when employees perform their roles correctly.
Teams can examine:
- Process steps
- Standard operating procedures
- Approval requirements
- Handoffs between departments
- Workflow interruptions
- Process controls
- Inspection points
Process mapping can complement Fishbone Analysis by helping teams visualize where failures may occur.
If a process depends on unclear instructions or unnecessary manual steps, the solution may require process redesign rather than additional employee training.
Equipment: Identifying Technical Contributors
Equipment can significantly affect quality, productivity, and safety.
A machine may produce inconsistent results because of wear, poor maintenance, incorrect settings, outdated technology, or inadequate calibration.
Teams should investigate questions such as:
- Was the equipment operating within specifications?
- Was maintenance completed on schedule?
- Was calibration current?
- Were settings appropriate?
- Did equipment performance change before the problem occurred?
This analysis can help distinguish equipment-related causes from problems originating elsewhere.
Materials: Assessing Input Quality
The quality of inputs directly influences process outputs.
Materials can include raw materials, components, chemicals, packaging, data, or other resources required for production or service delivery.
Potential questions include:
- Did the material meet specifications?
- Was the supplier consistent?
- Were materials stored correctly?
- Were incoming inspections adequate?
- Did material characteristics change?
Supplier performance and material variation can become important factors when organizations experience recurring quality problems.
Environment: Considering External Conditions
The working environment can influence processes in ways that teams may overlook.
Temperature, humidity, lighting, cleanliness, noise, workspace design, and other environmental conditions may affect equipment, materials, or employee performance.
Organizations should therefore consider whether environmental conditions changed around the time a problem occurred.
This category becomes particularly important in manufacturing, laboratories, healthcare, construction, and other environments where physical conditions can influence outcomes.
From Potential Causes to Verified Root Causes
Creating a Fishbone Diagram is only the beginning.
The next step is to investigate potential causes and determine which ones have supporting evidence. Teams can use process data, observations, interviews, records, measurements, and other reliable information to test their assumptions.
This helps prevent a common RCA mistake: treating the most obvious explanation as the root cause without verifying it.
A strong investigation moves through a logical sequence:
- Define the problem clearly.
- Identify potential contributing causes.
- Organize causes using the Fishbone Diagram.
- Gather evidence for relevant causes.
- Verify the actual root causes.
- Implement appropriate corrective actions.
- Monitor results to confirm effectiveness.
This approach creates a stronger connection between analysis and improvement.
Why Fishbone Analysis Supports Continuous Improvement
The value of Fishbone Analysis extends beyond solving one problem. It encourages teams to think systematically about process performance.
When employees learn to examine People, Process, Equipment, Materials, and Environment, they become less likely to jump to conclusions. They begin to look at relationships between different parts of the system.
This supports:
- Better problem definition
- More comprehensive investigations
- Stronger corrective actions
- Reduced recurrence of problems
- Improved process understanding
- Better team collaboration
- More informed decision-making
Over time, structured Root Cause Analysis can contribute to a stronger culture of continuous improvement.
How TUVWESTEN Supports Structured Problem Solving
Effective Root Cause Analysis requires more than using a problem-solving tool. Teams need the knowledge to define problems accurately, investigate potential causes, interpret evidence, and implement corrective actions effectively.
TUVWESTEN helps organizations strengthen their quality and problem-solving capabilities through professional training, consulting, and management system support. Its approach helps teams apply structured methodologies to real operational challenges while aligning improvement activities with broader quality and performance objectives.
By developing stronger problem-solving capabilities, organizations can move beyond temporary fixes and create more reliable processes.
Complex problems often have multiple contributing causes. Focusing on one explanation can leave important factors undiscovered and allow problems to return.
The Fishbone Diagram provides a practical framework for exploring potential causes across People, Process, Equipment, Materials, and Environment. When teams combine this structure with evidence-based investigation, they can identify genuine root causes and develop more effective corrective actions.
The goal is not simply to find a cause. It is to understand the system behind the problem and improve it.
With structured Root Cause Analysis and the right expertise from TUVWESTEN, organizations can strengthen problem-solving, reduce recurring failures, and build processes that support consistent, sustainable performance.